Introduction
It is well known that brittle materials only fail in tension. The glass experts at Read Consulting LLC were interested in how this would manifest itself under bend loads. Therefore tests were performed to understand how a brittle material would fracture in bending. The objective was to bend glass strips to failure and examine the crack pattern and the fracture surfaces. Four pieces were bent to failure, and all four had identical crack patterns and fracture surfaces.

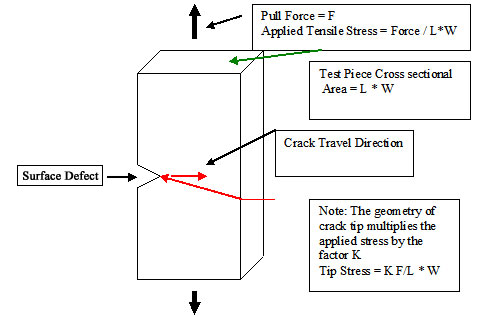
Figure #1: Schematic of crack propagation in a brittle material such as glass. The crack always moves in a direction perpendicular to the principal (i.e. maximum) tensile stress. The applied stress is multiplied by a stress concentration factor (K) at the tip of the crack; therefore, the actual stress at the crack tip = K x Applied Stress.
Procedure
Sample Preparation: Strips 1.5” X 9”of 0.23” thick glass were cut out of float sheet using a water cooled diamond saw.
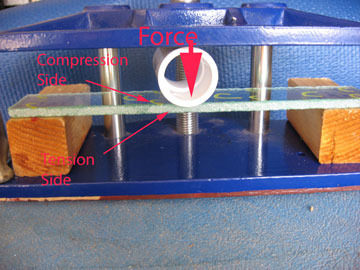
Bend Tests: Three point bending was used to break the strips (Figure #2).
Objective
Use three point bending forces to generate representative brittle bending fractures.
Results
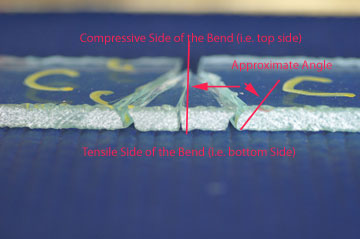
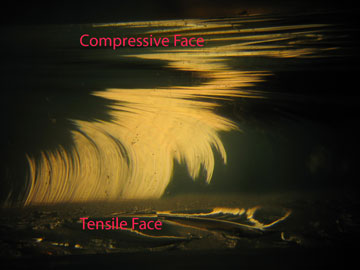
All four tests had identical failures. Each glass strip broke into three pieces; the center crack was straight and perpendicular to the glass face, and the two outer cracks were at an angle to the faces. The angles were all the same on all the samples; the opening was smaller on the compressive side. In addition, the crack front was consistent with the crack traveling faster on the tensile side of the bend. This is consistent with descriptions in the literature for brittle material failure analysis.

Figure #2: Photograph of the three point bend test used to break strips of 0.23” thick glass. The force was applied with a small vise. All the supports are made from a compliant material.

Figure #3: Photograph of the side view of a representative failure. Each glass strip broke into three pieces; the center crack was straight and perpendicular to the glass face, and the two outer cracks were at an angle to the faces. The angles were all the same on all the samples; the opening was smaller on the compressive side and wider on the tensile side. As the crack progressed through the thickness the stress orientation changed.

Figure #4: Representative fracture surface from the bend test. All four fracture surfaces on all test samples had identical fracture markings. On the compressive side, the crack “lagged” (i.e. it went slower). The crack front was hooked with the “long end of the hook” on the compressive side of the bend. This behavior is consistent with crack front descriptions in the literature.


